
Because of the complexity of the forex market, it is difficult to discover an optimal signal for predicting the possible development of market trends, if such an indicator exists at all. However, forex divergence-convergence may be one of the finest indicators for predicting how the market will act in the future, allowing investors to make the most informed trading choices. If you want to learn how to trade divergence and convergence in forex, this article is for you.
What is Forex Divergence and Convergence?
Technical analysts often use the terms “convergence” and “divergence” to describe the relationship between price and indicator movements. Below are comprehensive ideas for each phrase to help you understand them better.
Forex Divergence
An asset, indicator, or index’s associated asset, indicator, or index moves in the opposite direction when its value changes. The word that is used to describe this is divergence. When prices diverge, it might mean that the current trend is waning or, worse, that prices are about to shift.
Divergence may be either positive or negative. Positive divergence, for instance, happens when a stock is about to reach a low but its indications are beginning to rise. This might indicate a trend reversal and provide the trader with a chance to enter the market. Conversely, negative divergence occurs when the indicator points to a new low yet prices continue to rise.
Even when divergence does occur, it does not indicate that a price reversal is imminent or that it will happen at all. As divergence may really persist for a long period, relying only on it might result in significant losses if the price moves against your expectations. Divergence is not often the only factor used by traders in their trading activity. This is because it isn’t sufficient to provide timely trading signals by itself.
Pros
- Early warning signs of a possible trend reversal: Divergence may give traders a heads-up on when to join or exit positions before the trend really shifts back.
- Divergence is an objective indicator of momentum that may be used to support or contradict price patterns.
- Simple to use: Traders of all skill levels may easily spot divergence by using well-known technical indicators like the RSI and MACD.
- Can be used with other indicators: To further validate trade signals, divergence can be combined with other technical analysis tools like support and resistance levels.
Cons
- Subjectivity: Divergence identification requires subjective interpretation, which may cause many traders to interpret the same data differently.
- misleading signals: Divergence may give rise to misleading signals, particularly in erratic markets, which might prompt traders to take positions or withdraw them too soon.
- Lagging indicator: Although divergence may be used to detect a possible trend reversal early on, it is still a lagging signal, which means that it might not be able to precisely forecast when the trend would reverse.
- Restricted application: Divergence operates best in markets that are moving, but it may not be useful in other situations that are sideways.
Forex Convergence
The reverse of divergence is called convergence. It is used to characterize the occurrence of the underlying commodity’s futures price and cash price gradually approaching each other. The price behavior of a futures contract is often described by traders using the term convergence.
In theory, convergence occurs as a result of an efficient market’s inability to permit simultaneous transaction for two prices. Because traders must account for the security’s time value, the real market value of a futures contract is less than the contract price at stake. The time value premium decreases as the two prices converge as the contract’s expiry date draws near.
In the event that the prices did not converge, traders would profit quickly by taking advantage of the price differential. Until prices converged, this would keep happening. Arbitrage opportunities arise when prices do not converge. When an asset is purchased and sold simultaneously in many marketplaces to profit from a brief price differential, this is known as arbitrage. This scenario capitalizes on market inefficiencies.
Pros
- Gives a precise indication of when to sell (divergence) and purchase (crossover).
- Used as a momentum and trend indicator
- Improves analytical clarity when combined with other technical indicators
Cons
- May provide reversal signals that will just cause a sideways movement or brief halt rather than a major reversal.
- Provide a trend analysis that is less precise.
- Frequently, convergence provide trade signals in quite narrow price ranges prior to the development of a significant sideways signal. This is probably going to cause a little loss several times in a row.
What’s Indicator Used for Divergence and Convergence in Forex?
Forex divergence and convergence trading may make use of a variety of forex indicators. Among these, the following are the most prevalent ones:
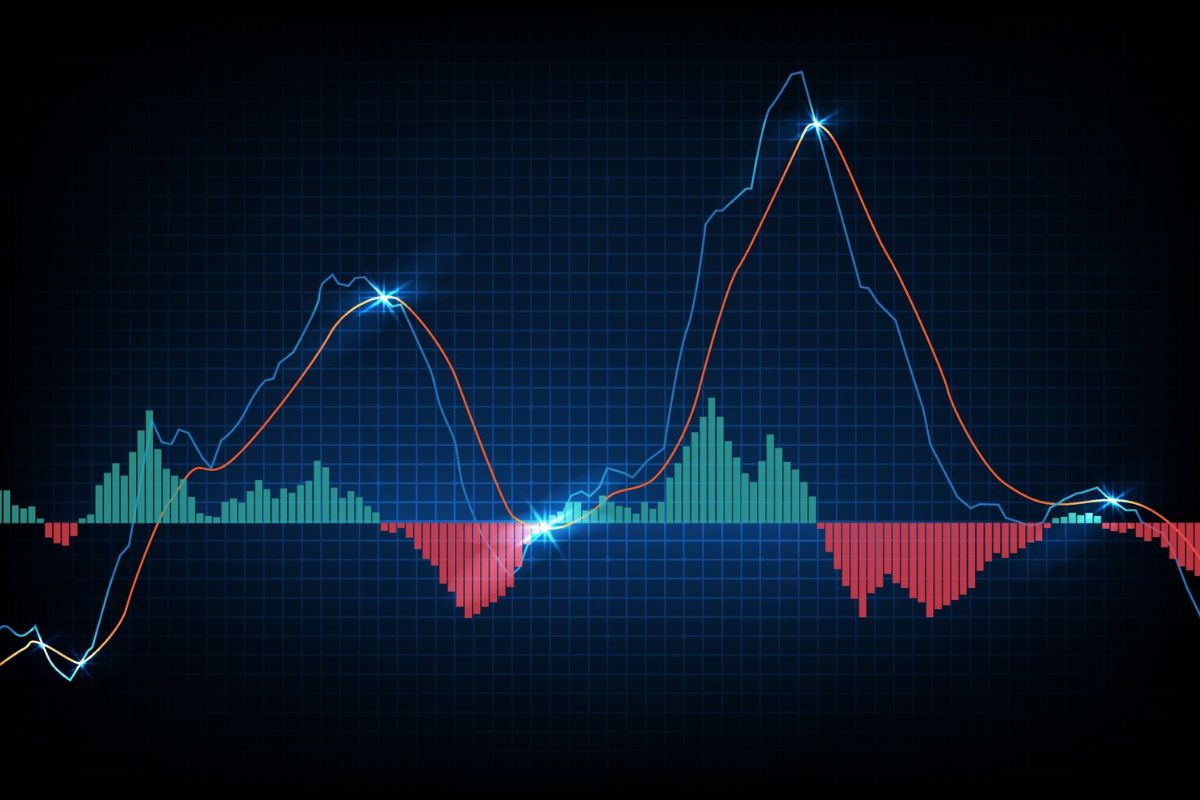
- The Moving Average Convergence Divergence (MACD) forex divergence indicator is derived by analyzing the exponential moving average values of a technical indicator over a period of either 26 or 12 days, or 9 days. When trading forex using divergence, the MACD histogram may be used to show the times when the price swings higher or down but the MACD does not. In actuality, this kind of scenario highlights how price and momentum differ. The MACD is a very simple and user-friendly divergence forex indicator.
- The Relative Strength Index (RSI) is a forex divergence indicator that compares the upward and downward price movement averages of a company after evaluating its intrinsic strength. Finding the point at which price and RSI begin to diverge is the primary objective when using the RSI chart, which is similar to how the MACD histogram is used. For traders who know how to do basic technical analysis, this could be the finest divergence indicator available in the forex market.
- The stochastic indicator is a momentum indicator used in divergence trading that is based on analyzing the closing price of a stock and comparing it to its price range over a certain time frame. Its use follows the exact same plan as the previous two indications.
- The Relative Vigor Index (RVI) gauges the intensity and direction of a trend. It is often used to determine probable trend reversals and validate trend direction.
You must compare the highs and lows of the price action with the highs and lows of the indicator in order to identify divergence and convergence on these indicators. When they coincide, convergence occurs. You have divergence if they are different. To link the highs and lows and more clearly see the divergence or convergence, you may use a trend line or a horizontal line.
Why Is Trading at Divergence and Convergence Important?
One really effective technique is the convergence and divergence tool. The fact that this analysis is not trailing is one of its key advantages. Convergence and divergence analysis are very helpful in projecting future price behavior based on existing values, just as price action is. The inverse of lagging indicators is this. They constantly follow price action in their growth by definition.
An occurrence linked to higher volatility is called divergence. An asset’s value may only deviate from its market value by a certain amount before it undergoes a significant price fluctuation and returns to its perceived value. Over the course of a particular trading session, more volatility generates more lucrative trading opportunities.
Strong divergence and convergence patterns might provide you with unusual trade chances that you may not have previously spotted.

As usual, price activity provides the most recent data. Pricing interpretation is an art, and it’s not a simple endeavor. It might be quite helpful to provide an analysis with more predictive value along with a way to support one’s approach.
How to Apply Divergence – Convergence Regularly
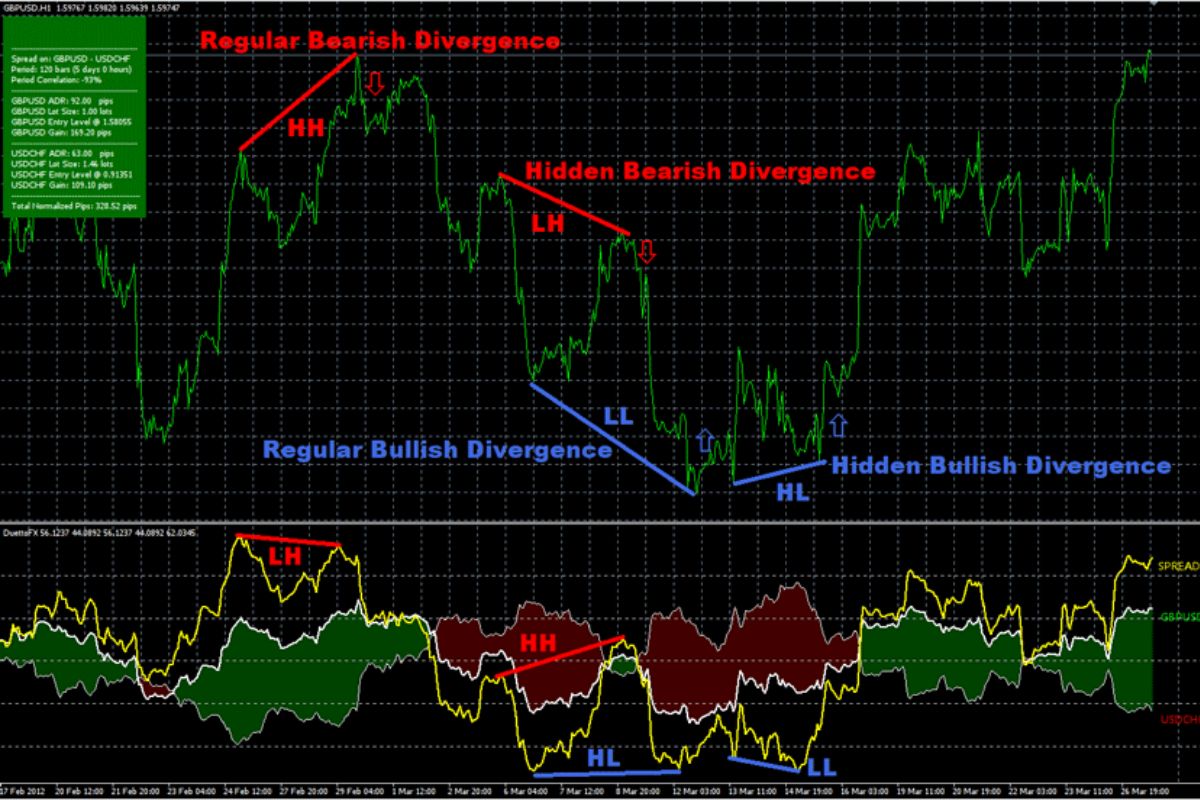
When doing a convergence-divergence study, it is critical to consider how price turning points change relative to time. Are the top peaks for these prices growing or decreasing over time? What about the lowest points? Understanding the important link between these turning moments will allow you to become a far more successful trader.
A regular divergence is utilized to indicate a trend stop or reversal, while a regular bullish divergence happens when the price makes lower lows (LL). However, the oscillator is producing higher lows (HL). Typically, this occurs around the conclusion of a decline. Price and momentum are predicted to move together. If the price establishes a new low but the oscillator fails to do the same, the price is likely to retrace or reverse.
The reverse is true for frequent bearish divergence. This occurs when the price hits a higher high (HH) while the oscillator produces a lower high (LH). Such divergence may be noticed in an upward trend. When this divergence happens, the price is likely to retrace or reverse.
Divergence and convergence may be employed in several ways, including:
- When the currency is converging, the probability of the trend continuing is strong. Trend reversal is improbable (this recommendation is less accurate on shorter time periods).
- When the currency diverges, the chance of trend continuance decreases. This indicates that a trend reversal is probable.
- When the currency experiences double or triple divergence, the chance of the trend continuing is low. A trend reversal is a possible possibility.

The oscillators show that momentum is likely altering. Even if the price has reached a new top or bottom, the likelihood of the momentum being maintained and extended is reducing. Regular divergence is useful for carefully forecasting the end of a trend.
Only in a few situations can the currency pair completely invert to form an opposing trend. Can I emphasis the word cautious in the preceding sentence? It’s a challenging trade aspect to master. Adding additional means of validating a trend’s possible termination is always good.
Conclusion
Forex Divergence and Convergence is a popular trading strategy, but it takes time for novices to become successful by using it. Visit our website https://wmt.wecopytrade.com/blog to learn more about trading or to stay up to date on key investment information and suggestions. Furthermore, WeCopyTrade offers a Funded Trading program, which provides funds for novice participants to confidently engage in the investing game. Find out more and join up for our program now!