Forex charts are the first thing that traders need to understand before trading. They are an essential tool for Forex traders since the majority of analysis and exchange rate forecasting is accomplished based on Forex charts. So what are Forex charts? How many types of Forex charts are there? How to read them properly? Let’s check out this detailed guide!
What are Forex Charts?
A Forex chart is a graphical representation that shows how the price of a currency pair in the foreign exchange market changes over time. The price is plotted on the vertical y-axis while the horizontal x-axis shows time. Trading platforms let you select different timeframes to display new price data, from minute-by-minute to monthly.
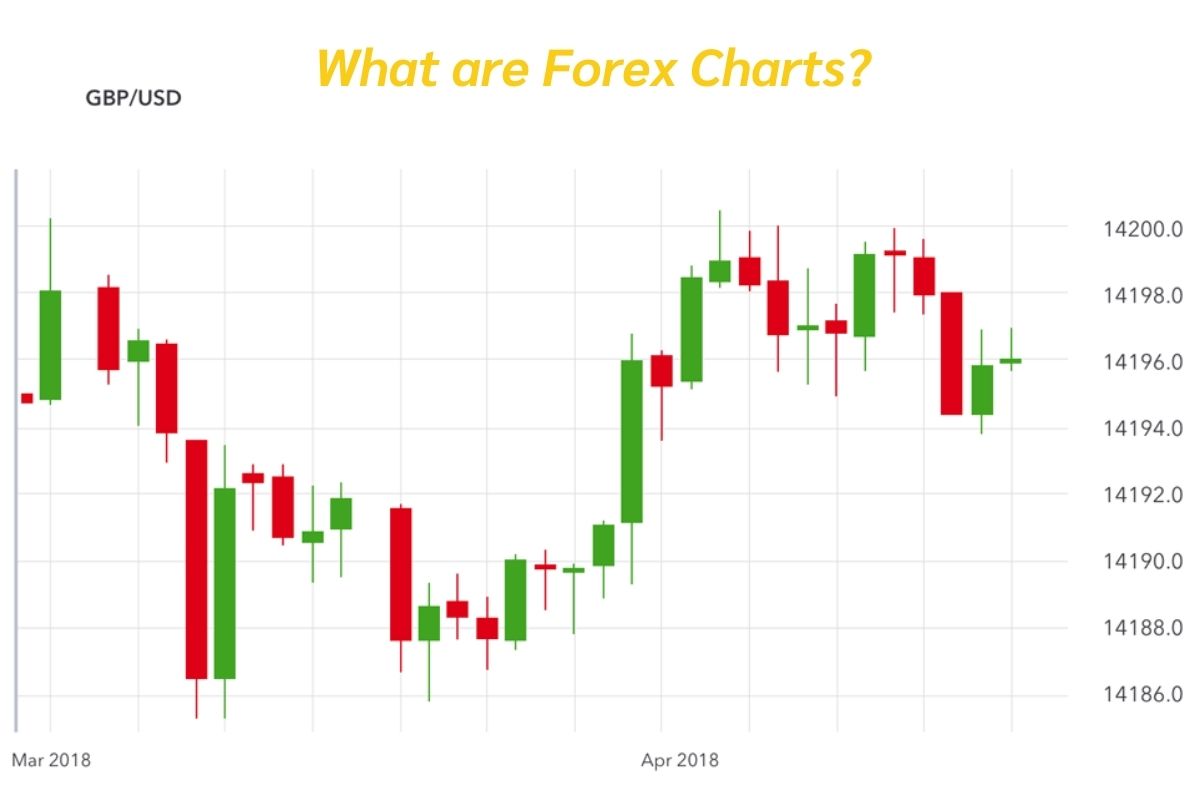
Forex traders use the data below to build the charts:
- Open (opening price): The price of an instrument at the start of a trading session.
- Close (losing price): The price of an instrument at the end of a trading session.
- High: The maximum price for a given period.
- Low: The minimum price of a given period.
- Volume: The number of contracts signed during a certain period.
These charts allow traders and technical analysts to watch, analyze, and comprehend currency price data, both historical and current. As a result, Forex traders may spot trends and patterns to make more informed currency purchases or sales decisions. In addition, they can add technical indicators to charts. Indicators will help identify trends and patterns in price movements. This will help them predict which way prices may move next.
How do Forex Chart Timeframes Work?
Forex charts show currency price movements over different periods. These periods are called “timeframes”. Some timeframes that are available on charts include: 5 minutes, 15 minutes, 30 minutes, 1 hour, 4 hours, 1 day, 1 week, and 1 month.
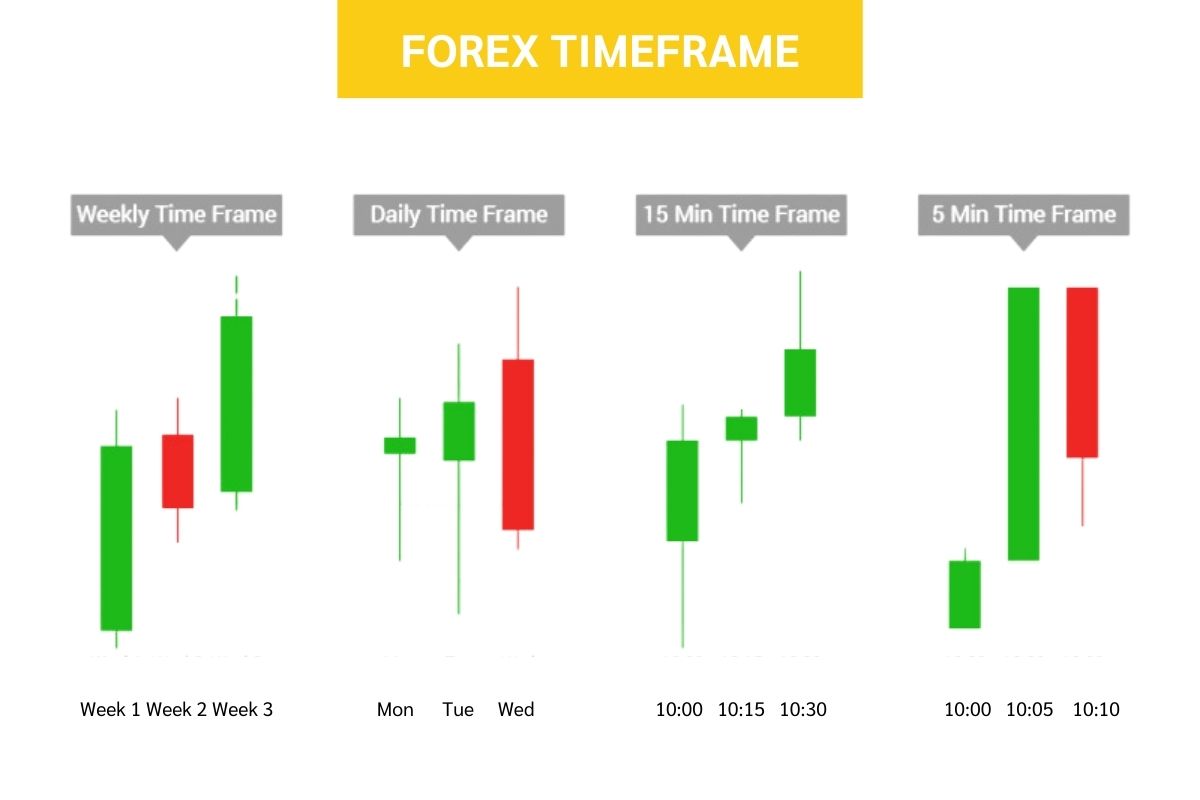
The timeframe setting determines how often the price data on the chart updates. For example:
- On a 5-minute chart, each bar will show the high, low, open, and close prices over 5 minutes.
- On a daily chart (1-day timeframe): each bar displays the price action over a full day.
Shorter timeframes like 5-minute updates more frequently, giving a closer view of prices. But they can be noisy with small fluctuations. A daily chart makes it easier to see the overall trend over weeks and months.
You should choose timeframes based on your strategy. If you are a beginner, start on longer timeframes like the daily or 4-hour charts. These make patterns and trends clearer compared to very short timeframes which are harder to analyze effectively.
Types of Forex Charts
There are three main types of Forex charts. Now let’s delve into the features of each type:
Line chart
The line chart is one of the simplest displays. It connects the prices over time with a continuous line, making it easy to spot trends and movements, however, it does not show opening, high, and low prices within each period.
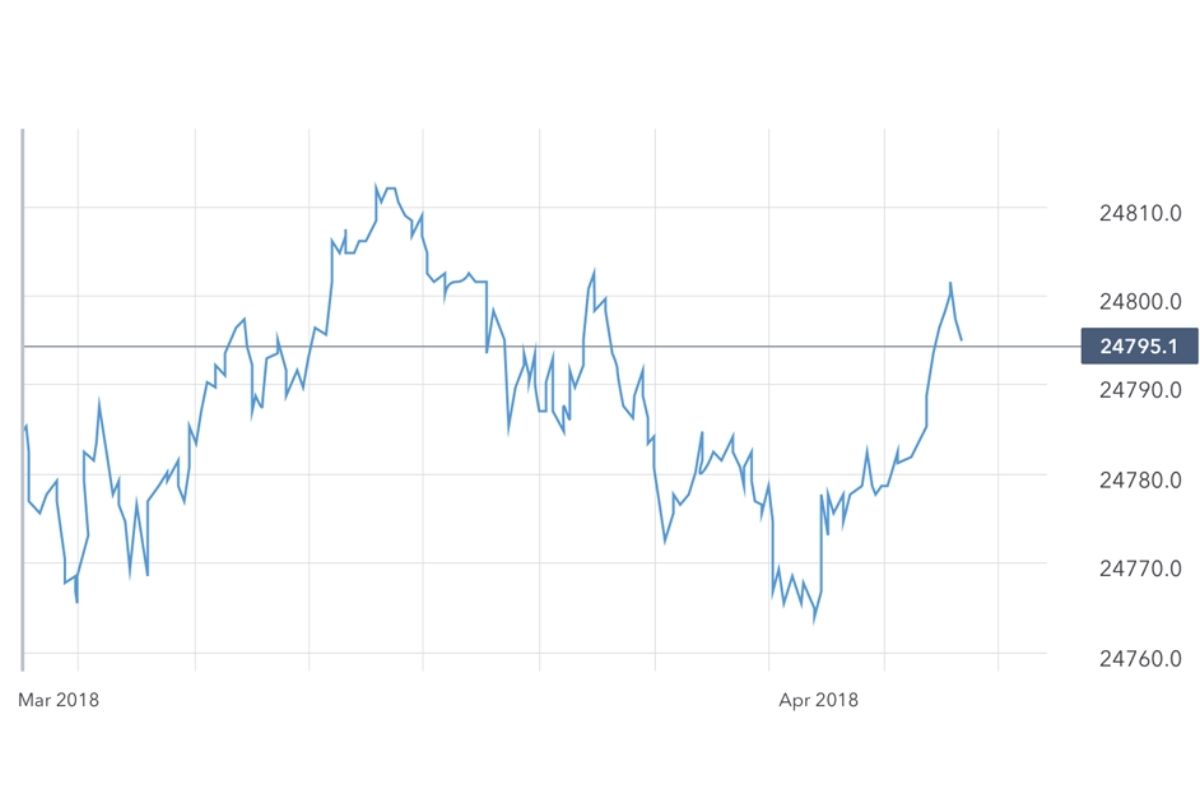
If you only want to see the closing values of a currency pair, the peaks and through of trends, or the performance over a longer period, you may use line charts, which offer fewer distractions than other types of Forex charts.
Candlestick chart
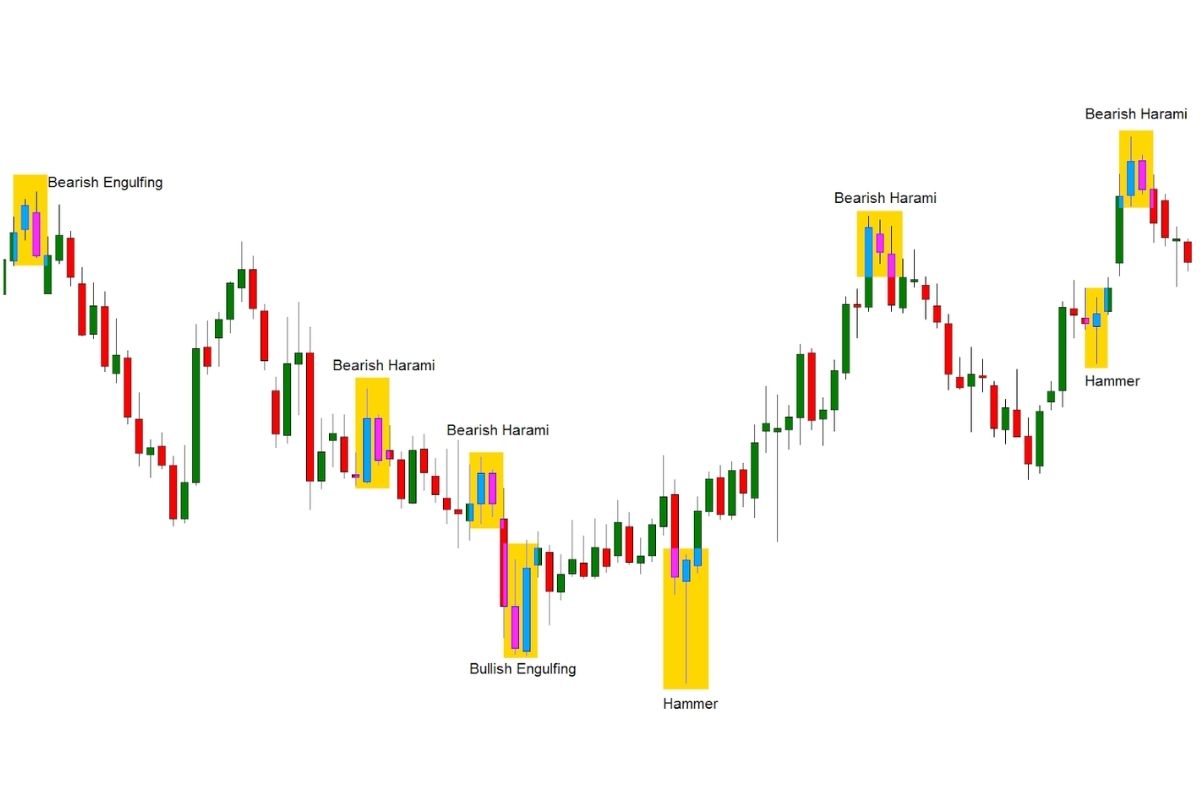
The candlestick chart paints a more detailed picture. Each period (say, one day) is represented by a “candle” – a rectangle topped with a thin line. The box part shows the range between the opening and closing prices, while the line on top shows the high and low. Up candles have lines above the box and down candles below. This visual cue helps identify trends at a glance.
Bar chart
Then there is the bar chart. It is similar to the candlestick chart, with the exception that it does not have a solid body. Each period is a vertical bar that highlights the high, low, open, and close. The vertical bar shows the pair’s trading range (from low to high), the left dash represents the opening price and the right dash the closing price.
How to Read Forex Charts Effectively
Now that you know the definition and the main types of Forex charts as well as how Forex chart timeframes work. It is time to find out how to read Forex charts. Here is how:
Select the chart type
Decide if you are a fan of line, bar, or candlestick charts. The two most comment types are candlestick charts and line charts. Each has its own style, so pick the one that is suitable for you.
Choose the timeframe
You can look at charts that show hours, days, or months. Start with a daily or weekly chart to see the broader trends. You can then zoom in on smaller time frames like 15 minutes or 5 minutes. On the chart you will see two numbers – these are the currencies. The one on the bottom is what you exchange, and the top is what you get. So if you see EUR/USD, the EUR is on the bottom and USD on top.
Identify trends and patterns
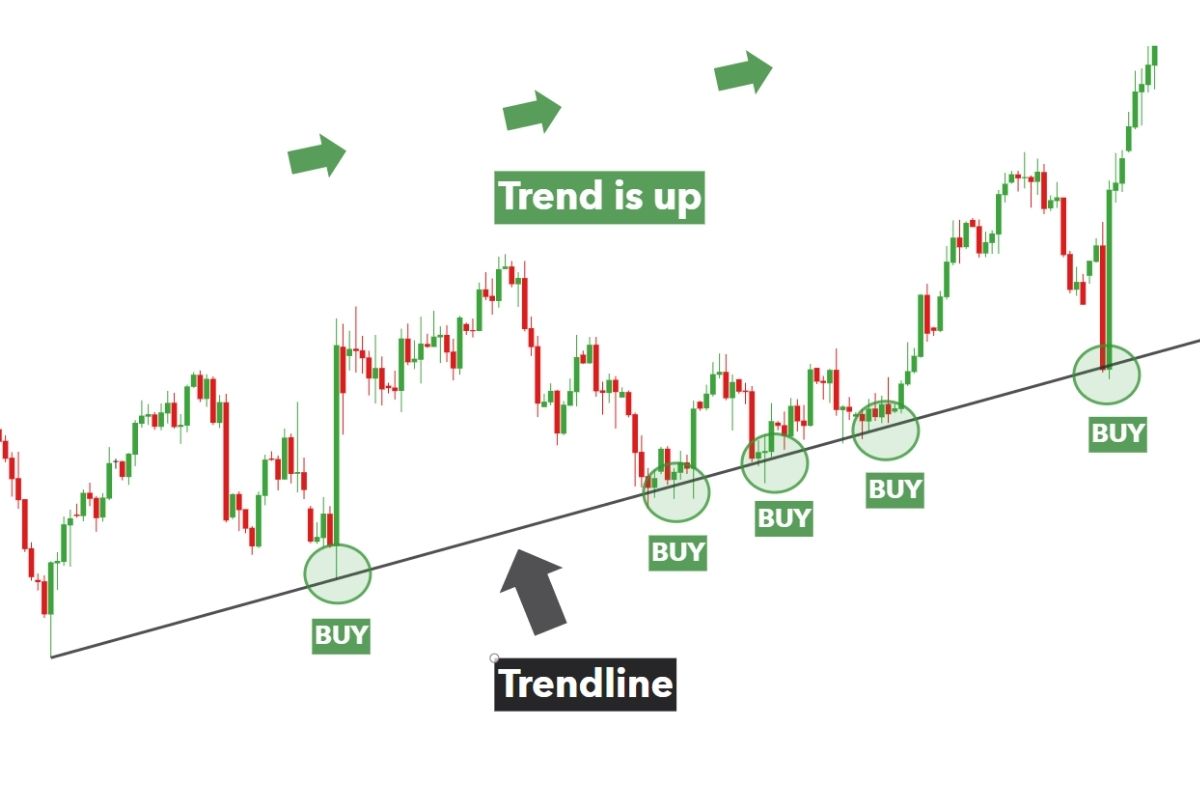
You need to look for the overall direction of the chart. Is the general movement going steadily upwards? Then it is considered an uptrend. If prices are consistently dropping, it is a downtrend. You should also look for formations such as double tops/ bottoms, triangles, and head and shoulders, which all may indicate what might happen next.
Locate support and resistance levels
These are price levels that tend to hold as a floor or ceiling when revisited. They can act as turning points for reversals. You should be prepared for a new direction. It is also helpful to spot areas where prices tended to stop and turn around repeatedly in the past. These support and resistance levels can help predict future behavior.
Zoom in and out as needed
You may switch between longer-term trends and shorter time frames to fine-tune entry and exit points. By zooming in on smaller time periods, you may see intraday ups and downs. However, staying focused on the bigger picture help you avoid getting lost in short-term noise.
Tips for Choosing the Right Chart
Taking some time to explore and find the chart can help you discover the one that suits you. The right Forex charts for you depend on your priorities, trading style, and comfort level. The following tips will help you opt for the appropriate Forex chart:
- Consider your trading style and timeframe. Day traders may prefer shorter timeframes like 5 minutes while swing traders look at daily or 4-hour charts.
- Choose a chart that makes you comfortable without overloading you with unnecessary detail at first.
- Start with common timeframes like 1 hour, 4 hours or daily before experimenting with shorter periods.
- Be open to adjusting your preferred chart as your understanding improves over time. Keep what works for your strategy.
Final Words
To sum up, Forex charts is a crucial tool that help Forex traders analyze the price movement and make more informed decisions on buying or selling. For beginners, it is important to start by familirizing yourself with the basics about Forex charts. With practive, you will get comfortable visually analyzing charts to form trading strategies. For more Forex trading tips, visit our website at WeCopyTrade and https://wmt.wecopytrade.com/blog.


