
Underlying all the daily ups and downs of a stock’s price chart is a certain market trend. Successful stock trading necessitates the ability to effectively recognize and comprehend these patterns. Whether you are an experienced trader or a newbie, understanding trends in the market is critical for making informed decisions. This article will explain the concept of stock market trends, their main types, and tactics for accurately identifying market trends.

What is a Stock Market Trend?
Stock prices can be turbulent in the short term and they do not necessarily move in a straight line. A more definite stock market trend may be found by looking at somewhat longer-term price trends.
A stock market trend, in general, is the broad direction in which stock market prices move over time. It reflects the general mood and conduct of market players. Traders might spot it by looking at prior price movements. Understanding stock market trends is critical for investors because it allows them to make better-educated decisions about whether to buy, sell, or hold stocks.

Traders frequently identify a trend in technical analysis based on characteristics such as how much the stock climbed when it moved up and how little it declined when it moved down. In other words, consider how far the stock price has risen – the top – or how far it has plummeted – the bottom.
Types of Stock Market Trends
There are three main types of stock market trends: uptrends, downtrends, and sideways trends (also known as horizontal trends). They all give traders valuable information about the overall direction of stock prices and help them make educated decisions. Let us explore each kind in further detail:
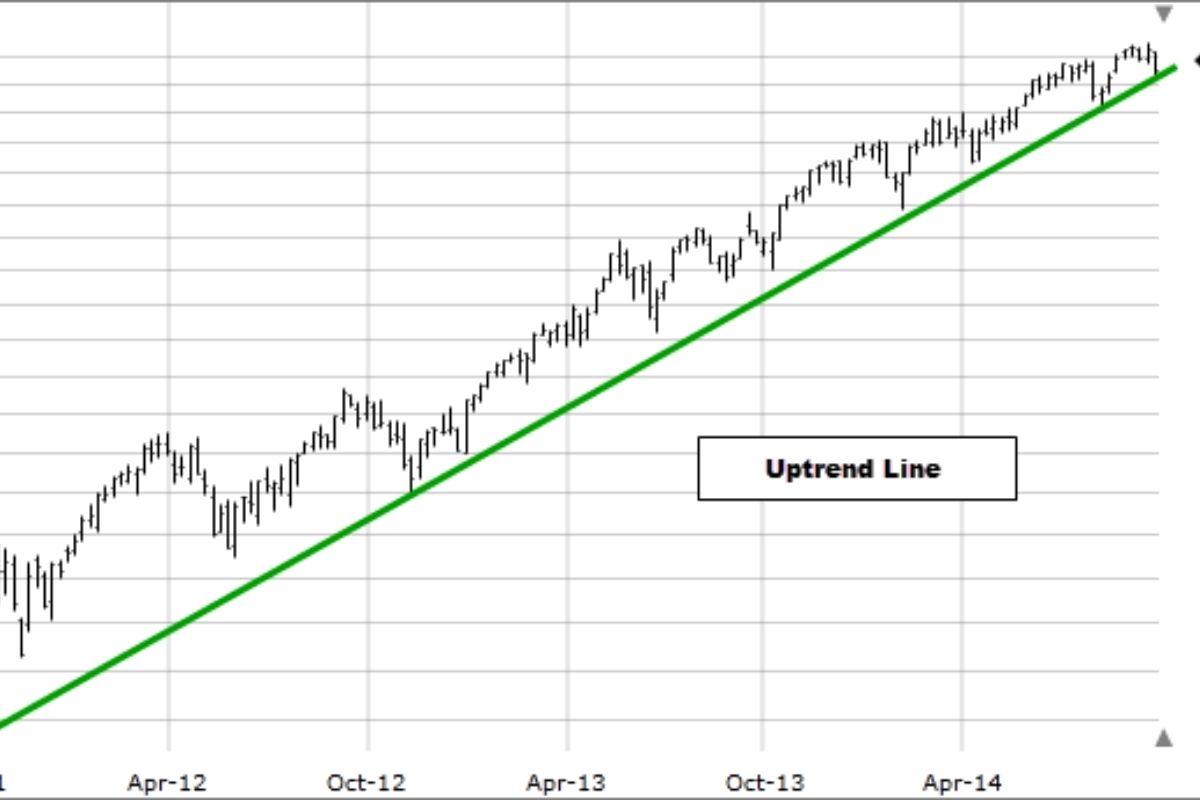
Uptrends
During an uptrend, the peaks (also known as tops) and troughs (or bottoms) of a stock chart increase sequentially. Therefore, every day or so, the stock price reaches a new high and then comes back down. This consistent rise in peaks and bottoms implies that the market is positive. It anticipates that the stock will appreciate rather than depreciate. Traders in an uptrend are optimistic, and there is a higher demand for stocks.
Downtrends
A downtrend is a trend in which a stock consistently falls. Not only are subsequent peaks lower, but so are successive bottoms. This suggests that traders believe the stock will continue to decrease. Investors exploit each small increase in the stock’s price to sell their current quota of shares. At these prices, no additional purchases are made. You should not buy such a stock, regardless of how much the stock price has dropped – especially if you are a short-term investor. If you are a long-term investor, you may want to hold off on buying until the stock price falls even more.
Sideways/ Horizontal trends
During a sideways trend, a stock does not move substantially in any direction for an extended time. Peaks and troughs remain consistent, and there is no major movement to decide whether to purchase or sell a stock.
Advantages of Identifying Trends
Recognizing these trends is crucial for investors and traders as it helps them make strategic decisions based on the current market environment. There are several important benefits of identifying trends in technical analysis.
- Recognizing trends enables you to identify and trade the overall trends in any timeframe quickly and decisively.
- Trend identification tells you whether and how trend reversals might be leveraged for short-term profit.
- Understanding the market’s underlying trend allows you to map support and resistance levels with better clarity and precision in an effective manner.
- By monitoring stock market trends, you may remain ahead of the competition and find opportunities before they become publicly publicized. This knowledge can provide investors with a major competitive advantage over other market players.
- Trend analysis helps you identify possible reversals or changes in the market. For instance, recognizing a downtrend may prompt you to implement risk mitigation tactics like setting stop-loss orders.

How to Recognize Stock Market Trends?
Recognizing market trends is an essential skill for stock investors. You can utilize various tools and techniques to identify trends and make informed decisions. Here is how:
Understanding the basics of stock market trends
You should get acquainted with the fundamental ideas of trends, such as uptrends, downtrends, and sideways trends. The upward movement of the stock price is an uptrend, whereas the downward movement is referred to as a downtrend. Market participants often tend to purchase equities that appear to be in an uptrend and sell those that appear to be in a downtrend. A sideways trend indicates a lack of direction.
Using charts and technical analysis
Charts and technical analysis are two invaluable tools for you to make the most of market trends. You can utilize charting tools to visually inspect price fluctuations across various time frames. In addition, technical analysis delves into the study of patterns, indicators, and trends derived from market data. You can apply its indicators such as moving averages, trendlines, and momentum oscillators to identify patterns and confirm trends.

Moving averages
Moving averages (or MA) are a stock indicator that investors use while conducting technical analysis. The primary goal of computing moving averages is to lessen the influence of short-term price volatility on a company over a certain period.
Moving averages are useful for smoothing out price volatility and determining trend direction. When a short-term moving average crosses above a long-term moving average, it indicates an uptrend (golden cross), whereas crossing below indicates a downturn (death cross).
Trendlines
Understanding trendlines is critical for efficiently recognizing market trends. A trendline is a line that links all of the troughs and peaks in a stock chart. A trendline that links the peaks allows you to chart the growth that a stock has shown over time. The one that links the troughs assists you in tracking the dangers associated with the stock.
To determine the slope and direction of a trend, draw trendlines linking successive highs or lows. They can aid in trend confirmation and identify prospective entry and exit locations.
Monitoring news and economic indicators
It is vital to stay updated on key news and indicators. Stock prices can be greatly influenced by news events, economic releases, earnings reports, and geopolitical happenings. Smart traders use this knowledge to make quick judgments while remaining aware of the larger market backdrop.

Staying adaptive
Adaptability is key when seeking to identify stock market movements. Markets are dynamic, and trends may shift quickly. Successful investors accept flexibility in their strategies, often reassessing and adjusting to changing market conditions. They can adjust rapidly to shifting trends, manage risks, and seize opportunities as they occur by being adaptive.
Considering multiple timeframes
Analyzing trends over several time frames, such as daily, weekly, and monthly, offers a comprehensive view. Short-term swings may differ from longer-term patterns, and a comprehensive perspective assists traders in determining the overall market direction. This multi-timeframe research enables them to make better judgments by aligning their tactics with both current market dynamics and long-term trends.
Follow the Master Trader
Some copy trading platforms will allow you to follow the master traders who can provide valuable market signals. These signals can help you easily detect the market trends.
Final Words
Recognizing stock market trends is a critical skill for effective trading. Utilizing a combination of technical analysis tools, fundamental analysis, and staying informed about market events can help you make more informed decisions. Keep in mind that market trends can change, and continuous monitoring and adaptation are essential for navigating the dynamic world of stock investing. For more trading guides, please visit our official website at https://wmt.wecopytrade.com/.