

Learning how to analyse Forex charts is one of the very first steps you should take to get into Forex trading. By practicing reading Forex charts, you will be able to predict where exchange rates may be headed next, thereby grasping profitable opportunities and making more informed selling and buying decisions. This guide will go over key techniques and a step-by-step guide for effective Forex chart analysis.
Understanding Forex Charts
A Forex chart shows changes in the foreign exchange rate of a currency pair over time. This is the real price at which a trader can buy or sell currencies.
Traders trading currencies on Forex trading platforms look at the same Forex charts and take conclusions from them. Chart analysis may seem boring; however, once you know how to make money from it, it can become rather engaging.
Types of Forex Charts
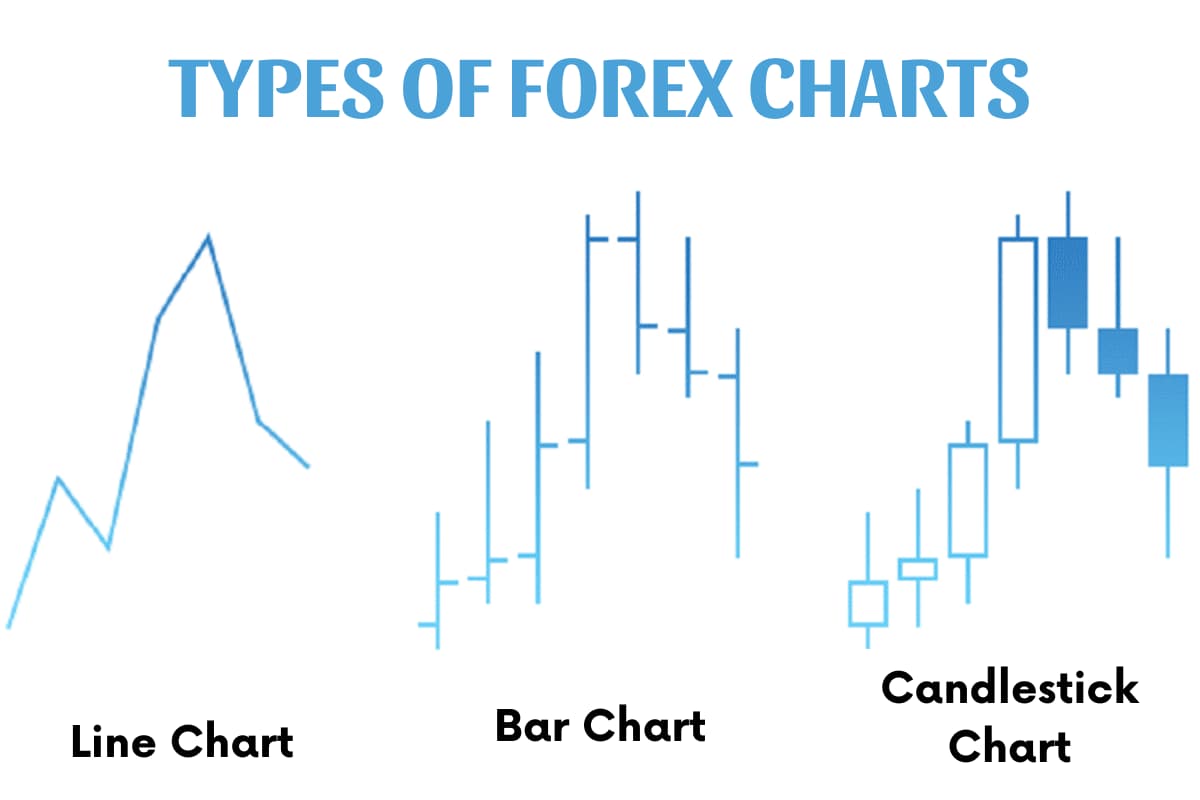
Here are three major types of Forex charts:
- Candlestick chart: This type of Forex chart shows the opening, closing, high, and low prices of a currency pair within a specific period, usually daily or hourly. You can see trends at first sight by looking at small boxes or “candles”. This is the most popular among traders as it shows price patterns effectively.
- Line chart: This type is one of the simplest demonstrations. It simply connects the closing prices of each period with a line. You can get a smooth picture of trends over time with this type of Forex chart.
- Bar chart: The Bar chart displays price information for a specific period using vertical bars. Each bar has high, low, open, and close prices. Traders can quickly assess the price range and direction during the specified timeframe.
Timeframes and Their Significance
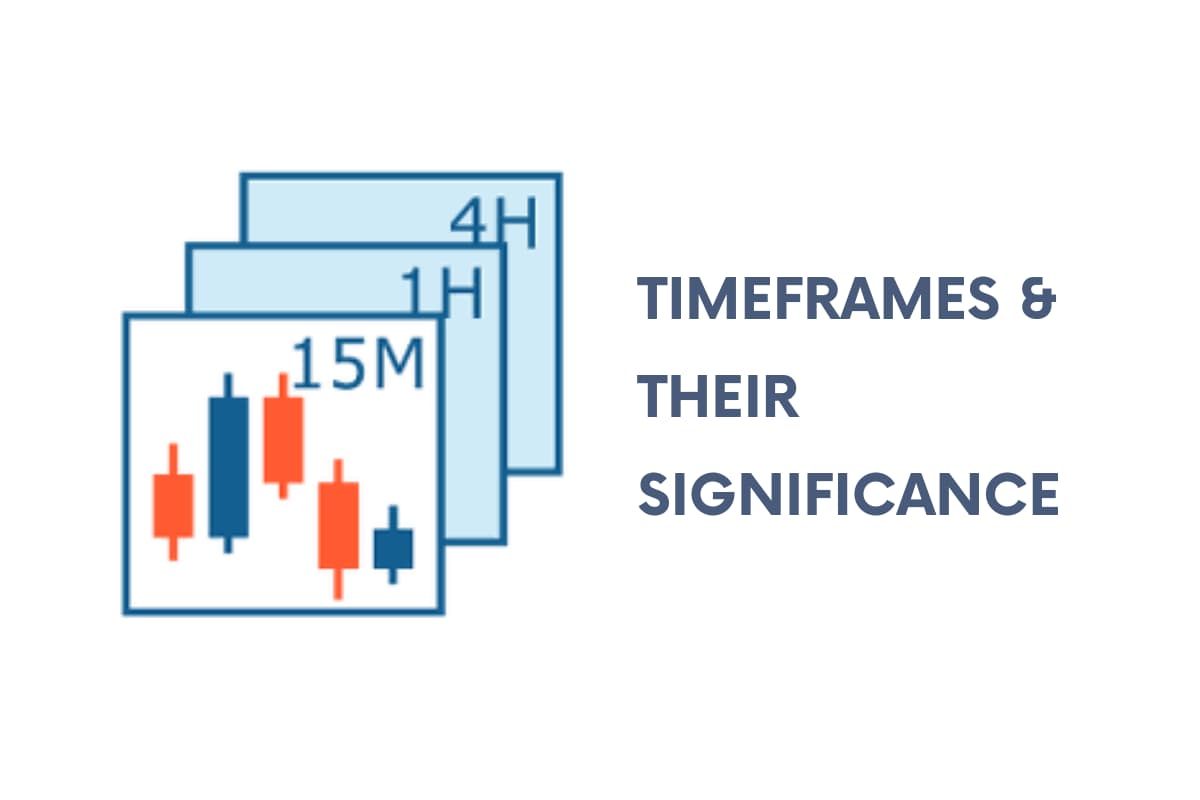
Forex charts show the price movements of the currency over different periods. These periods are referred to as “timeframes”. Some popular ones include 5-minute timeframe, 15-minute timeframe, 30-minute timeframe, 1-hour timeframe, 4-hour timeframe, 1-week timeframe, 1-day timeframe, 1-month timeframe, etc.
- On a 5-minute Forex chart, each bar shows the price movements over 5 minutes.
- On a 1-day Forex chart, each bar shows the price action over one day.
Shorter timeframes like 5 minutes update more often, giving a closer view of price action as it develops. Daily charts offer a simpler way to see patterns over weeks and months at a higher level.
It is best to pick timeframes that match your strategy as the timeframe you choose significantly affects your Forex analysis. If you are new, start with bigger scales like 4 hours or daily. These tend to make trends and shapes clearer compared to very tight time windows that clutter shorter-term noise.
Key Technical Analysis Tools
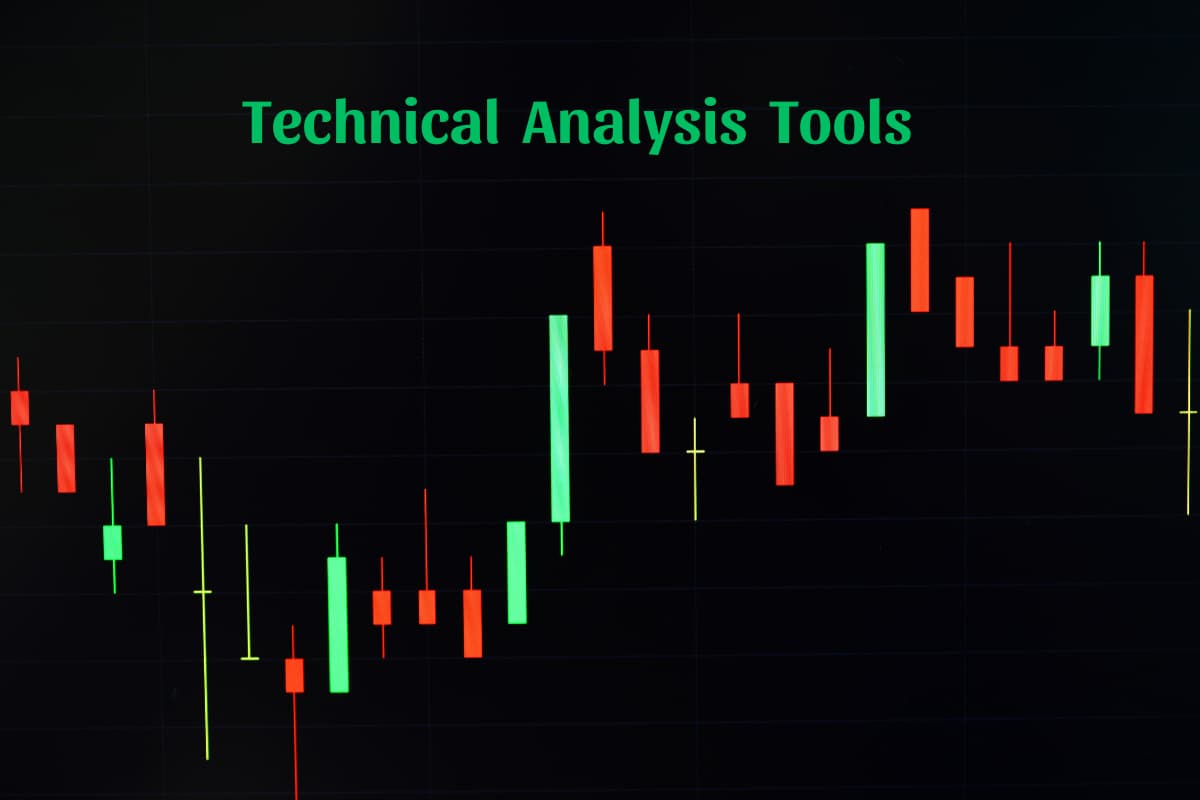
By using these key technical indicators, you can analyse Forex charts more deeply.
- Moving Averages (MA): MAs smooth out price data by calculating the average price over several periods (days, hours, etc.) and help identify trends. They include two main forms: Simple Moving Average (SMA) – which uses the raw closing prices to calculate the average and Exponential Moving Average (EMA) – which weights recent prices more than older prices.
- Relative Strength Index (RSI): The RSI is a momentum oscillator that measures whether a currency pair is oversold or overbought. It may be an effective tool to determine when to enter and exit a trade.
Steps to Analyse Forex Charts
Analysing Forex charts is one of the most important skills for any Forex trader. By learning how to interpret chart patterns and signals, you will be able to make smarter trading decisions. Here are the key steps to follow when reading Forex charts:
Choose the right chart type and timeframe
The first step is selecting the chart type such as line, candlestick, or bar graphs. Candlesticks display valuable data, but simpler line charts work too. Pick a time frame like daily or 4-hourly based on your strategy. Experiment to find the best view.
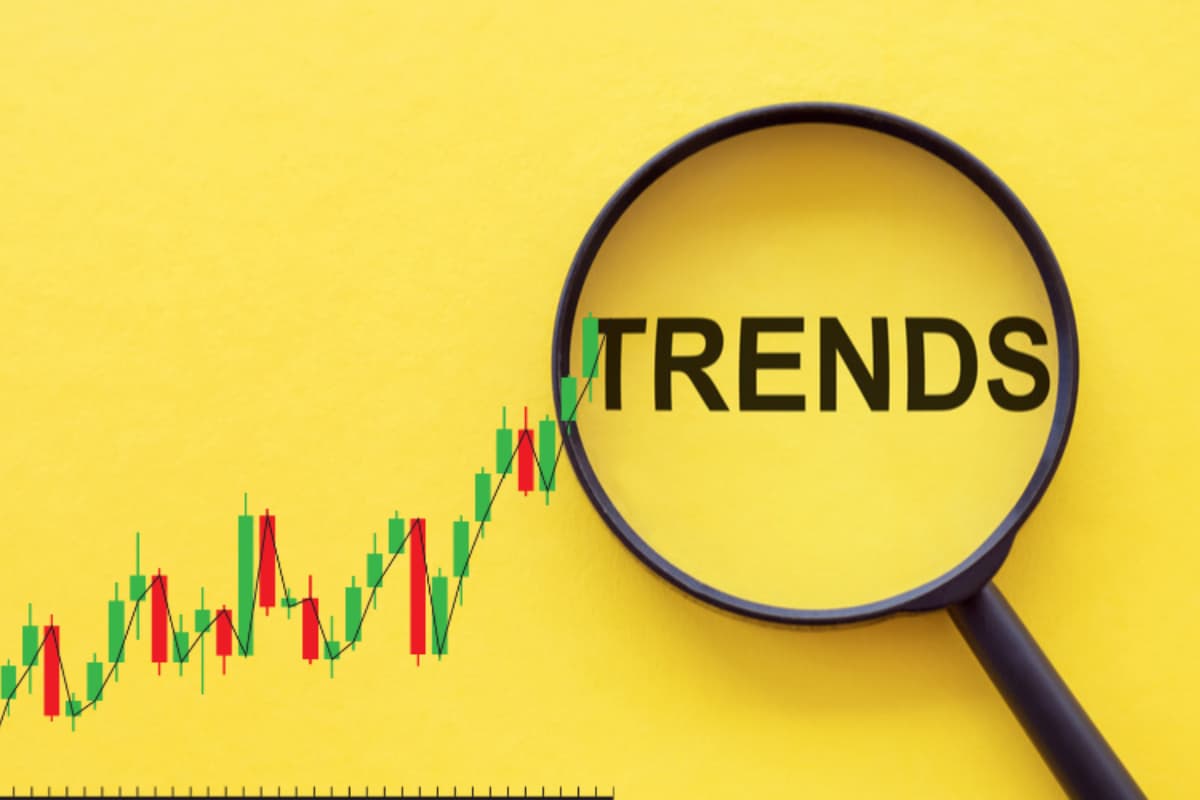
Identify the trend
Scan the chart to determine if prices are trending consistently higher or lower over the past few weeks/months. Train your eye to spot support and resistance levels. Taking note of the overall direction is crucial.
Use technical indicators
To confirm trends and signals, overlay indicators like moving averages (MA). The 50-day MA helps identify short-term momentum changes, for example. Overbought/ oversold indicators like RSI are also useful. Remember to wait for numerous signals to confirm your chart analysis before making a transaction. This helps lower the risk of erroneous signals.
Recognize chart patterns
You need to search for common chart patterns, including head and shoulders, double tops, and flags. These patterns can provide insights into potential price movements.
- Head and shoulders patterns are a trusted reversal chart pattern that can indicate a change in trend direction (uptrend or downtrend).
- Double tops and bottoms are reversal chart patterns that Top Forex traders often use to predict trend reversals.
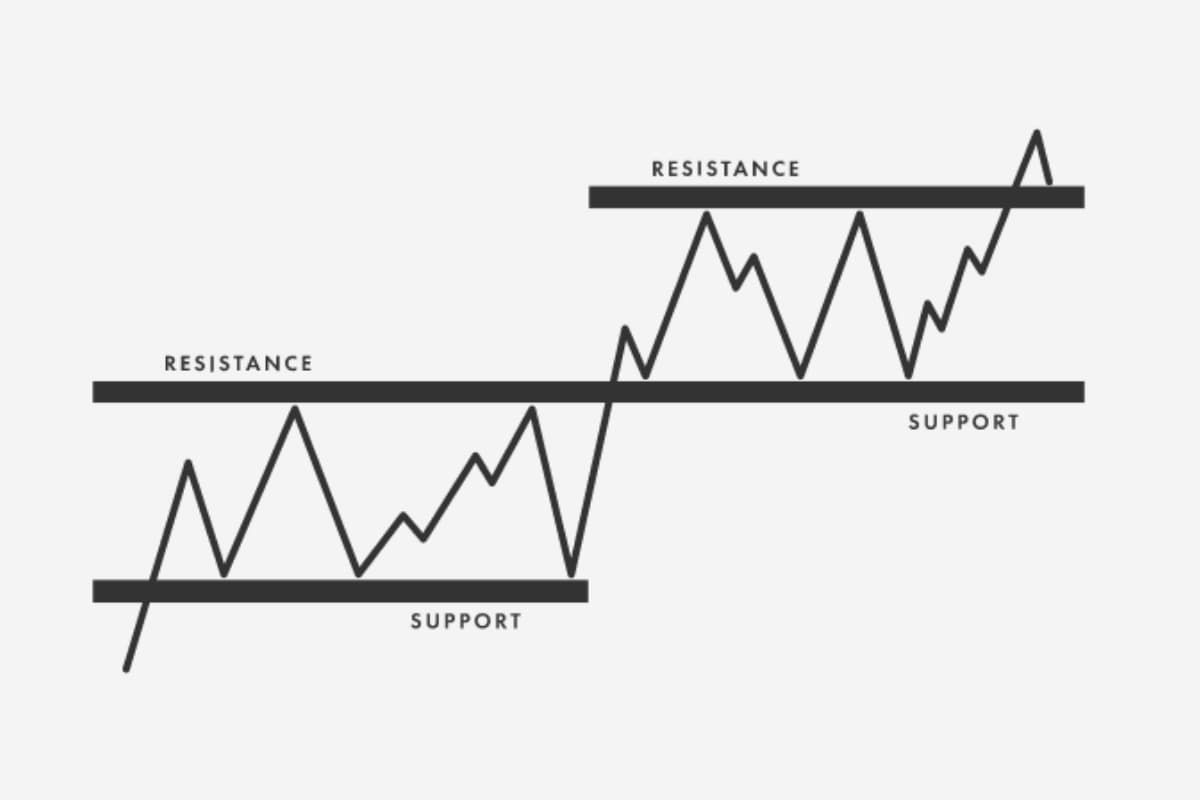
Support and resistance levels
It is essential to identify key support and resistance levels shown on the chart. They are crucial for setting take-profit and stop-loss orders. These levels are pricing levels that tend to serve as a floor or ceiling when reviewed. They may serve as pivot spots for reversals and you should be ready for a change of direction.
Risk Management
Handling risk in a smart way is extremely important when trading currencies. You need to understand how much loss you are comfortable with and use stop-loss orders to protect your funds. Place orders to limit losses and lock in gains according to your research and market outlook.
Pro Tip:
To make educated trading choices, lots of Forex traders think it is helpful to blend fundamental and technical analysis. Fundamental analysis examines economic and global political influences, while technical analysis focuses on how prices change over time. Looking at both perspectives can provide a well-rounded picture of current market dynamics.
Tips on How to Analyse Forex Charts Effectively
In addition to the techniques and tools mentioned above, the following additional tips also help you analyse Forex charts more effectively:
- Keep it simple: Keep your Forex analysis simple at first with just a few indicators rather than too many. Less is sometimes more when you’re learning.
- Practice with historical data: Review past price data without any pressure or risk. Practicing on historical data allows improving your analysis skills before trading for real.
- Stay informed about economic events: Stay aware of upcoming news that could swing currencies. Schedules help follow what stories may disrupt prices in the short term.
- Watch for divergence: Watch for disagreement between prices and indicators. When these diverge, it could signal a trend shift is near.
- Continuously learn and adapt: Upgrade your knowledge with webinars, books, or following expert analysis. Currencies evolve, so studying helps boost skills over time.
- Avoid overtrading: Be careful not to trade too much. Taking emotions out helps make wiser choices aligned with your plan.
- Seek mentorship: Consider guidance from seasoned traders. Their experience navigating challenges speeds learning curves.
Final Words
In conclusion, acquiring how to analyse Forex charts is a critical skill for any trader who wants to earn profit from the foreign exchange market. Whether you are a swing trader, day trader, or long-term investor, the ability to interpret and make trading decisions based on Forex chart is invaluable. By understanding all the techniques and tools, you can predict price movements and then improve your trading outcomes. Remember that practicing and continuous learning are crucial to enhance your analysis skills. For more helpful Forex trading techniques and tips, visit our official website at https://wecopytrade.com/ and https://wmt.wecopytrade.com/blog.