Candlestick patterns are an essential trading tool for any stock trader. By understanding common candle patterns, you may spot opportunities and avoid pitfalls. This blog post will cover what they are and how to read a candle pattern. We will also briefly introduce 10 essential candle patterns that can be spotted on price charts. Recognizing these patterns will help you see when a stock may be poised to rise or fall.
What is a Candle Pattern?
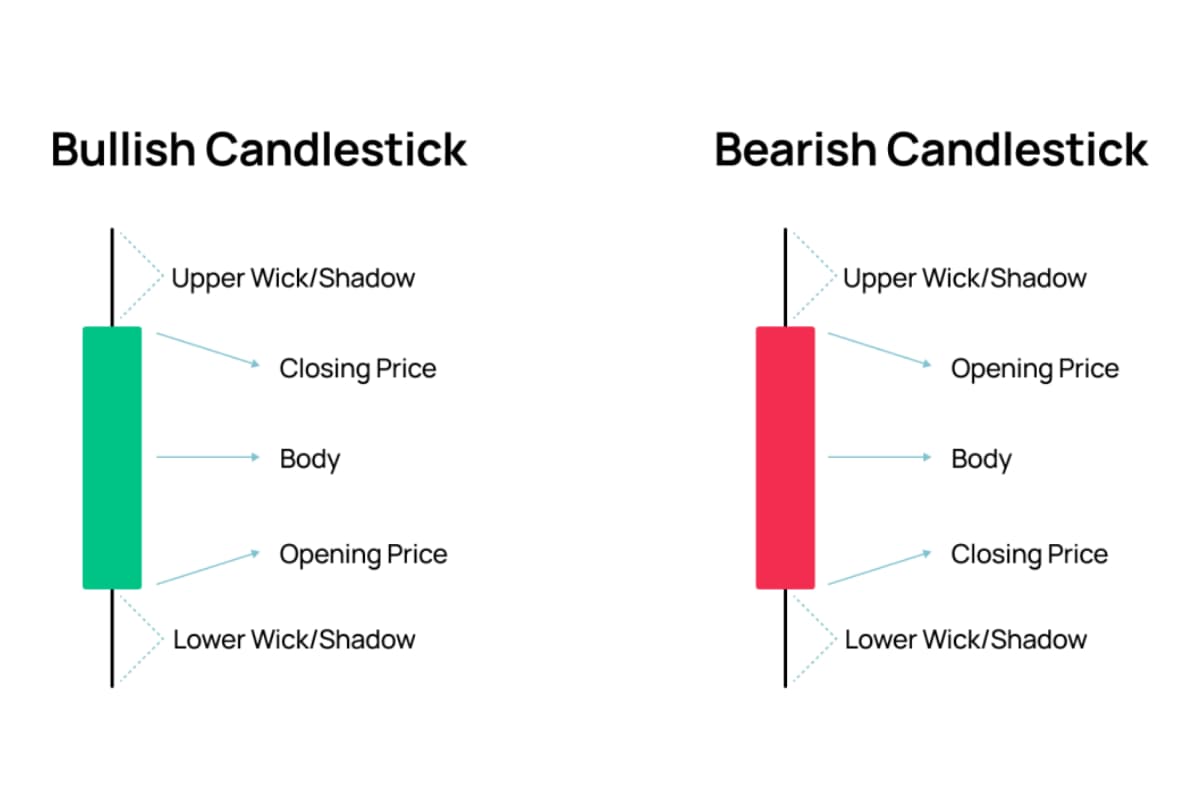
A candle pattern is a single bar which shows the price movement of a specific asset. Candlesticks display the open, close, high, and low prices for a specific time interval, usually a single day or hour, which allows traders to visualize market sentiment and momentum.
A candle pattern often includes three basic features:
- The wick (or shadow): shows the high price or low price for the candle.
- The body: shows the difference between the opening price and the closing price. The green candle shows that the close was higher than the open. The red one shows the open was higher than the close.
- The color: indicates the direction of market movement – a green (or while) body shows an increase in price while a red (or black) body indicates a price decrease.
By learning to spot these visual patterns in how prices move, traders can predict what the market may do next and find potential trading opportunities. Before you start trading, it is crucial to understand the basics of candle patterns and how they may inform your decisions.
Benefits of Using Candle Patterns
There are several key advantages of using candle patterns in your trading:
- Identification of support and resistance levels: Many classic candle patterns form at important price thresholds that markets have historically bounced off of. Spotting these can help traders anticipate where buyers or sellers may step in.
- Insight into market sentiment: The shape and color of candles provides a visual snapshot of whether fear or greed is dominating in that period. Patterns give clues as to what emotions may be driving prices.
- Increased probability of success: Certain candle patterns like bullish/ bearish engulfing candlesticks can predict future price moves at rates above random chance. Leveraging patterns with proven edge can help your trades work out more often.
- Simple to understand: Unlike complicated technical indicators, candle patterns are intuitive and easy to spot with the naked eye. No formulas to memorize, just basic visual shapes that emerge from price action over time.
Top 10 Most Popular Candle Patterns
While there is a wide range of candlestick patterns, we will focus on the most popular and reliable ones. Bullish patterns show up after a decrease and signal an upward turnaround, while bearish ones appear after an increase and predict a downward turnaround. Let us dive into the features of the top 10 candle patterns that every trader should know.
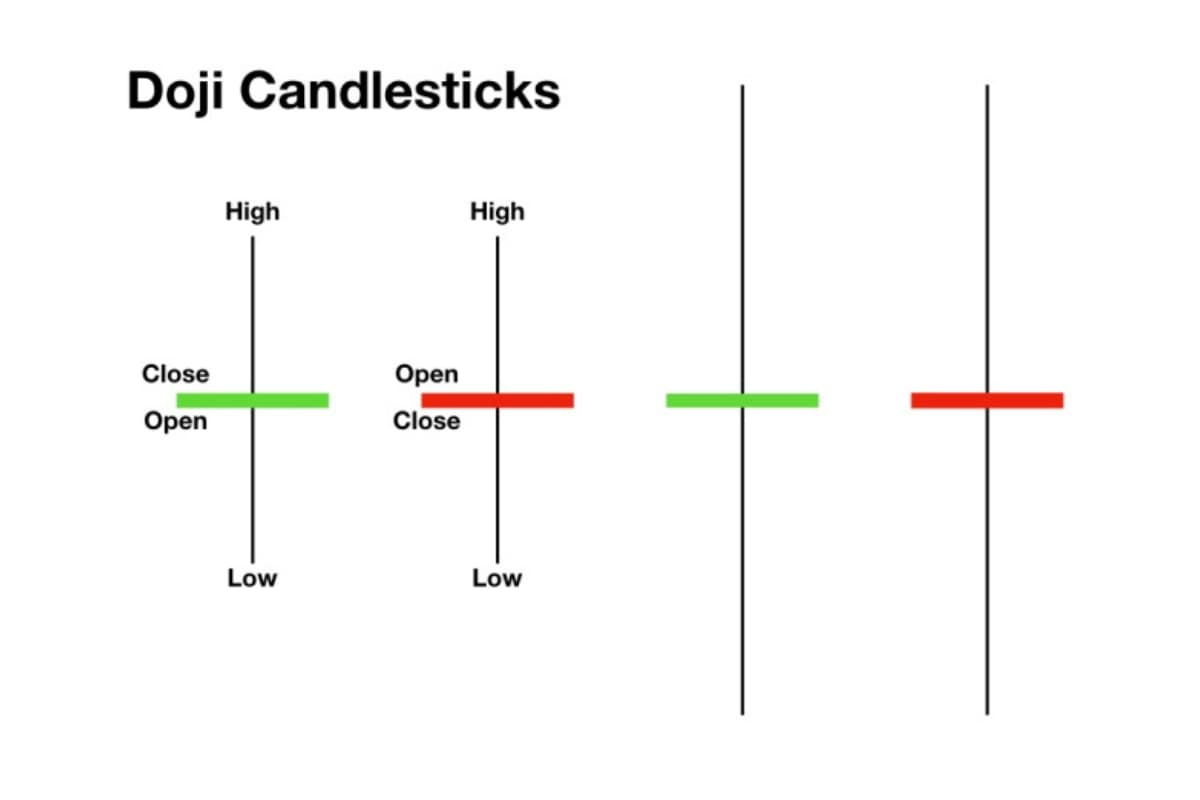
The Doji
A Doji candle pattern is a significant pattern in technical analysis that shows indecision in the market. The Doji has a small body between a long lower and upper wick. When it appears after a strong trend (up or down), it can signal a potential reversal. For example, a Doji after a downtrend might indicate that selling pressure is weakening, and the price could start to rise.
The Hammer
The Hammer is one of the most easily spotted candle patterns. It resembles a hammer, with a short body and an extensive lower wick or shadow that is more than twice the body’s length. This pattern signals that buyers stepped in to push the price significantly higher from the lows of the period. It is viewed as a sign that a downtrend may be reversing when it appears after a decline.
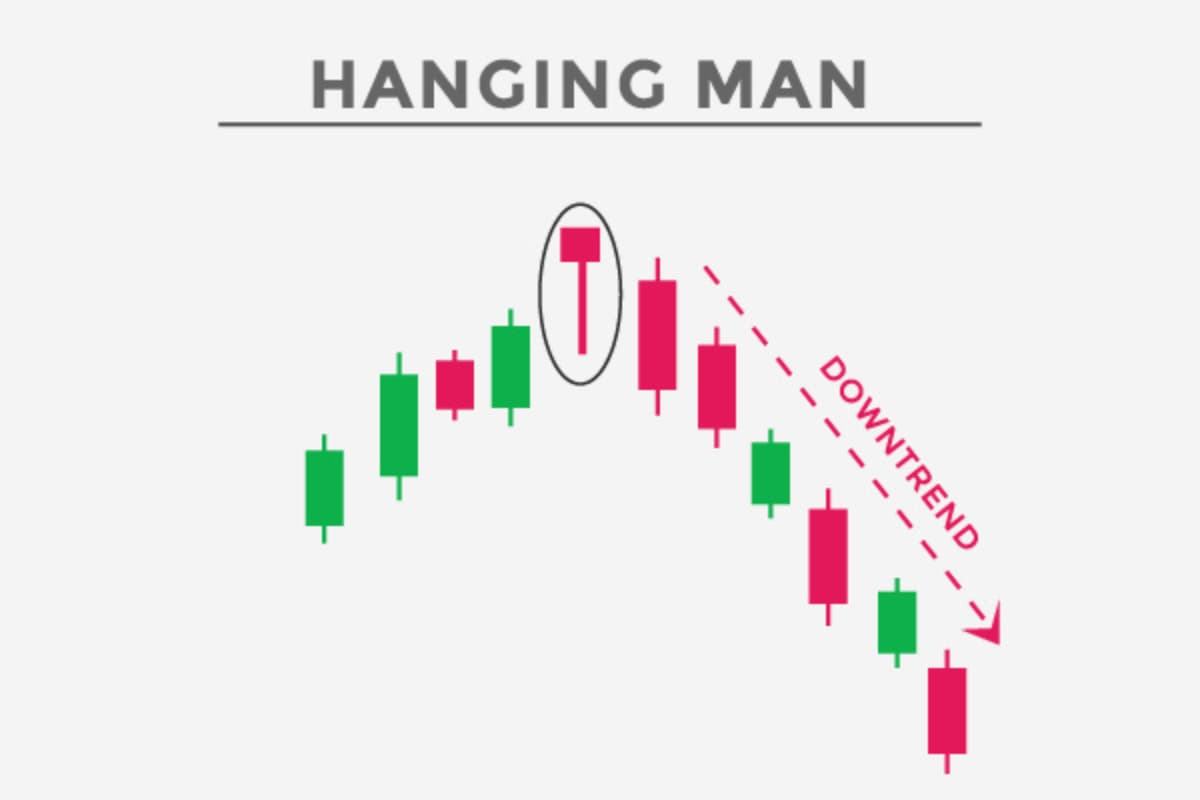
The Hanging Man
A green or red candle pattern with a small body and a long lower wick forms the hanging man. It usually appears at the end of an uptrend and signals an upcoming significant sell-off. Buyers might temporarily push prices up before losing control.
The Spinning Top
The spinning top candlestick pattern has a small body in the middle with wicks of equal length on both sides. This pattern shows that the market is undecided, with no significant change in price: buyers pushed the price up, and sellers brought it back down. Spinning tops usually mean the market is taking a break or consolidating after a big uptrend or downtrend.
By itself, the spinning top is not a strong signal, but it can hint at future changes by indicating that the current market pressure is weakening.
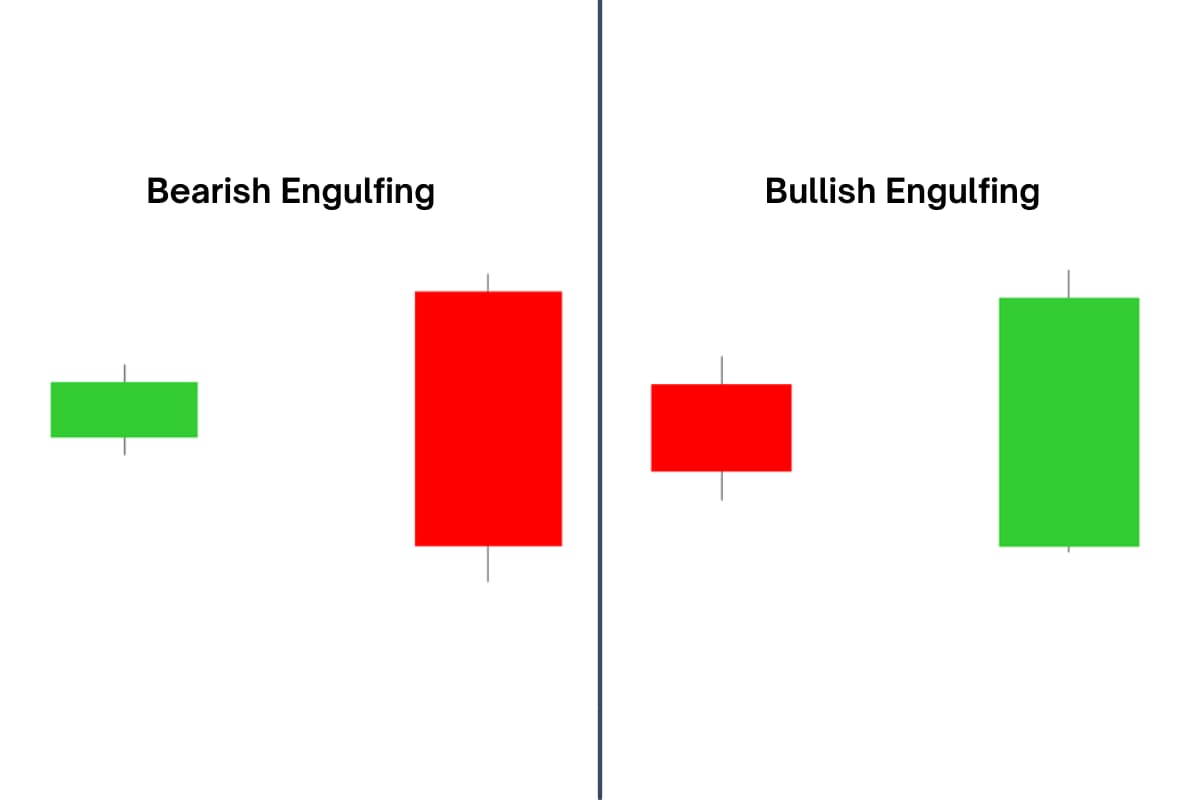
The Bullish & Bearish Engulfing Pattern
A bullish or bearish engulfing candle pattern may singal a potential change in direction.
- A bullish engulfing pattern represents bulls outweigh bears. As shown below, the green candle (bulls) fully engulfs the first red candle (bears).
- A bearish engulfing formation consists of a little green candlestick followed by a larger red candlestick that swallows up the initial small green one. This means that sellers took over for purchasers during that time.
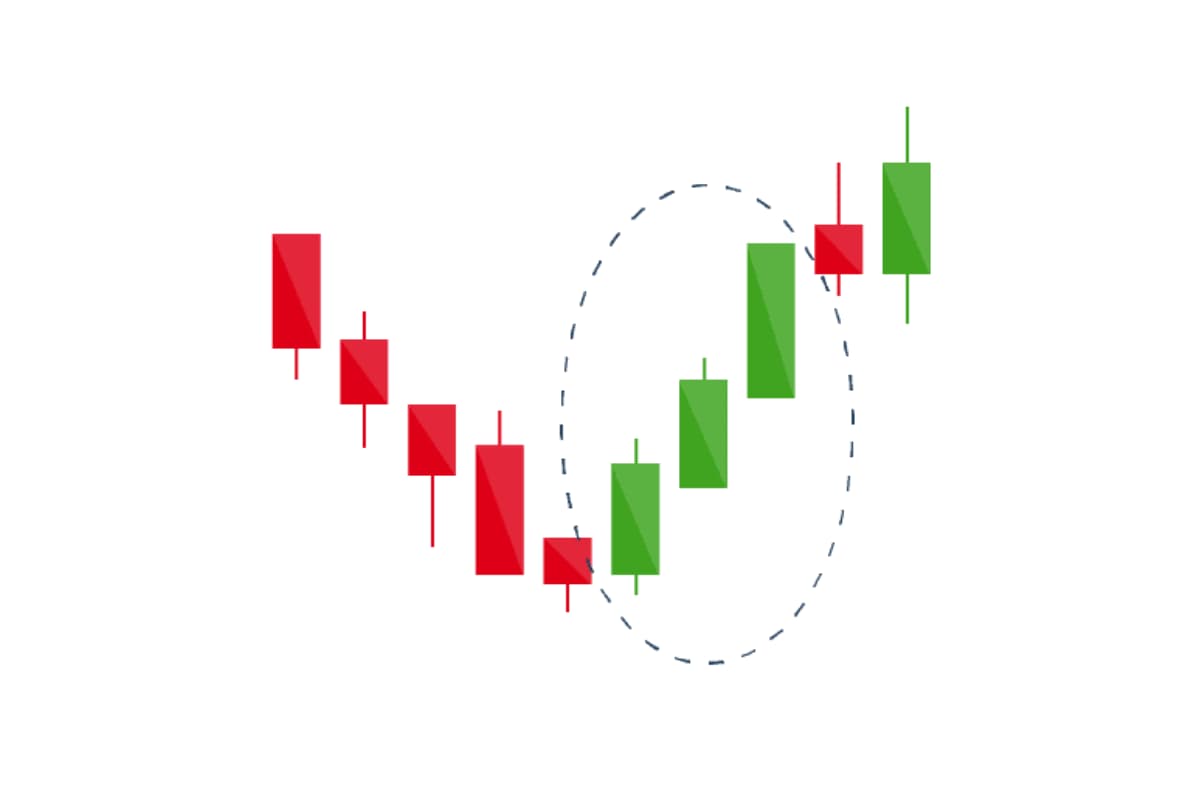
The Morning Star
The morning star candle pattern is regarded as a symbol of hope in grim market decline. It is a three-stick formation, with one short-bodied candlestick centered between a long red candlestick and a long green one. It indicates that the selling pressure from the first day has subsided and a bull market is imminent.
The Evening Star
The evening star candle pattern has three candles, like a morning star but for an ending uptrend instead of a downtrend. It shows a short middle candle between a long green candlestick and a big red candlestick. It signals a reversal of an uptrend and is especially powerful when the third candle wipes out the gains of the first candle.
The Shooting Star
This is a bearish candlestick with a long upper shadow, little or no lower shadow, and a tiny body near the day’s low. It shows up after an uptrend, and may indicate a potential reversal to a bearish trend.
The difference between the high and the starting price must be at least twice the size of the candle’s body, and the gap between the day’s lowest price and the closing price must be negligible or nonexistent.
The Three White Soldiers
This is another three-stick candle. It features three different tall green candlesticks in a row with very short shadows. Each green candle opens and closes higher than the one before. This pattern is seen as a robust bullish signal that shows up after a price decline.
The Three Black Crows
The three black crows candle pattern shows up as three long red candles in a row with short or no wicks. Each session begins at a same price as the previous day, but selling pressure drives the price down more and more with each close.
Traders see this patterns as the beginning of a bearish downtrend, indicating that sellers have taken control over buyers for three consecutive trading days.
Final Words
In conclusion, being able to recognize common candle patterns can greatly help traders anticipate market moves. Taking the time to learn the most prevalent formations like hammers, hanging man, and engulfing candles pays dividends. While patterns alone do not guarantee results, they provide valuable visual clues about crowd psychology and trend strength.
For further insights and trading tips, please checkout our WeMasterTrade Blog. Immerse yourself in the exciting trading world with WeCopyTrade.